Per questo 15° Prompt del Martedì, l’idea era testare un nuovo tipo di interfaccia utile e visivamente forte: una dashboard di progresso personale pensata per monitorare gli obiettivi nelle principali aree della vita.
Su Linkeum, i Prompt del Martedì non servono solo a produrre demo visivamente accattivanti, ma anche a testare interfacce che un giorno potrebbero diventare parti reali del prodotto. In questa 15ª edizione, l’idea era generare una dashboard di progresso personale capace di mostrare con chiarezza l’avanzamento di un utente in più dimensioni della sua vita.
L’obiettivo era andare oltre una semplice lista di obiettivi e immaginare un vero componente di dashboard che fosse leggibile, moderno e abbastanza forte dal punto di vista visivo da meritare un’esplorazione più approfondita.
Il prompt utilizzato
Questa volta, il prompt è stato scritto in modalità code only per ottenere direttamente un file HTML autonomo, facile da testare, facile da catturare in uno screenshot e potenzialmente riutilizzabile più avanti all’interno di Linkeum.
Il prompt inviato a Qwen era il seguente:
Generate code only.
Create a single self-contained HTML file with embedded CSS and JavaScript that builds a premium “Life Progress Dashboard” for Linkeum.
GOAL
The dashboard must help a user track progress across the major areas of life based on personal goals.
This is not a landing page.
This is not a marketing page.
This is a real product dashboard section designed for daily use.MAIN VISUAL
Build a large multi-ring radial progress chart as the main hero visualization.
Use a free JavaScript charting library suitable for radial / circular progress visualization.
Prefer Apache ECharts.The chart must represent 8 life categories:
- Wealth
- Career
- Learning
- Health
- Network
- Personal Projects
- Discipline
- Well-being
Each category must have:
- a progress percentage,
- a target marker or target logic,
- a label,
- a distinct but refined visual treatment.
Use realistic sample values such as:
- Wealth: 78
- Career: 64
- Learning: 82
- Health: 71
- Network: 58
- Personal Projects: 69
- Discipline: 75
- Well-being: 67
At the center of the radial visualization, display:
- “Overall Progress”
- and a combined percentage, for example 71%
The radial chart should look elegant, structured, readable, and premium.
Do not make it look playful or gimmicky.
Do not create a chaotic radar chart.
Do not use a generic fitness-app aesthetic.LAYOUT
Create a full dashboard section around the chart with:
- A left or center main chart area.
- A right-side details panel with category cards.
- Small KPI cards above or below for:
- Current streak
- Goals completed this week
- Best momentum
- Needs attention
- A “Focus Areas” card listing:
- Top 2 categories falling behind
- Top 2 categories improving fastest
- Small trend indicators or mini progress bars in the detail cards.
DESIGN STYLE
The design must match a premium Linkeum-like style:
- deep navy background or navy-tinted surfaces
- lighter blue highlights
- subtle amber/gold accents
- clean white or off-white text
- modern, professional, executive-grade UI
- modern fintech + personal intelligence dashboard
Avoid:
- neon colors
- rainbow palettes
- glassmorphism overload
- generic startup hero sections
- excessive gradients
- cartoonish visuals
Use a refined design system with:
- modern spacing
- subtle borders
- soft shadows
- polished cards
- clean typography
- a strong visual hierarchy
TECHNICAL REQUIREMENTS
- Output only one HTML file
- Include all CSS and JavaScript inside the HTML
- Use CDN imports only if needed
- Prefer Apache ECharts via CDN
- The result must run immediately when saved as an .html file and opened in a browser
- No external assets except the chart library CDN and web fonts if needed
- No frameworks like React, Vue, or Tailwind
- Pure HTML, CSS, and JavaScript only
- Code must be clean, readable, and well-structured
RESPONSIVENESS
The dashboard must be responsive.
- On desktop: chart + side panel layout
- On mobile: stacked layout with excellent readability
- Maintain strong visual hierarchy on smaller screens
INTERACTION
Even if this is a static HTML demo, make the UI feel interactive:
- hover states on cards
- hover emphasis on chart areas if possible
- subtle animated loading for the chart
- filter tabs such as 7D / 30D / 90D / 1Y
- active state styling
CONTENT
Use realistic product-like copy, for example:
- “Your life goals at a glance”
- “Focus on what moves the needle”
- “2 categories need attention this week”
- “Momentum is strongest in Learning and Wealth”
QUALITY BAR
The result should look like a real product dashboard mockup that could be screenshotted for an article and potentially reused later in a real product.Do not explain anything.
Do not output markdown.
Do not wrap the code in triple backticks.
Output raw HTML only.
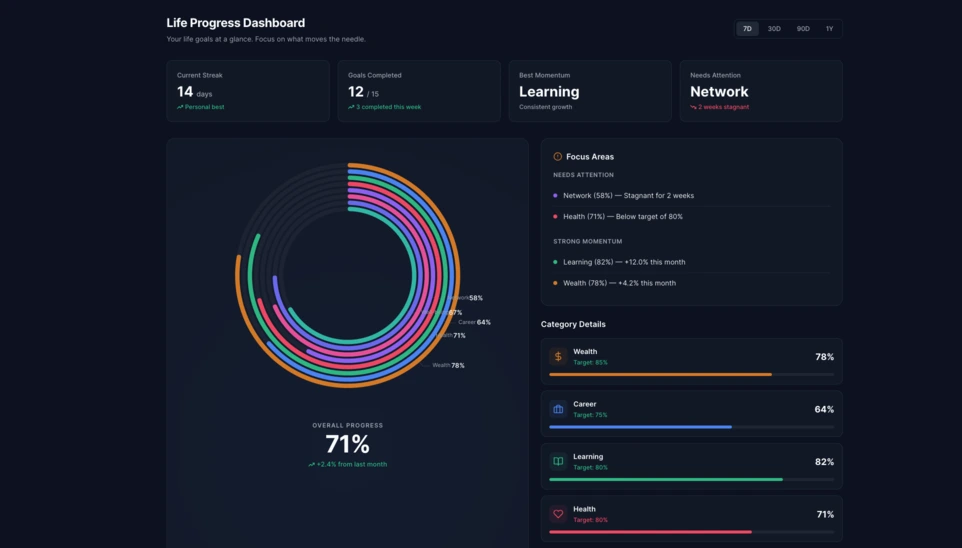
Il risultato
Il risultato generato da Qwen costituisce una base molto convincente. L’interfaccia si appoggia a un grande grafico radiale multi-anello al centro, accompagnato da schede KPI, un pannello focus e blocchi di dettaglio per categoria.
Ciò che rende interessante questo test non è solo l’effetto visivo. Ancora più importante, l’IA ha generato una struttura di dashboard credibile, riutilizzabile e già abbastanza pulita da poter servire come base per un futuro modulo di Linkeum.
Perché questo test è importante
Questo Prompt del Martedì dimostra che un buon prompt può produrre qualcosa di più di una demo impressionante. Può anche aiutare a prototipare rapidamente una vera interfaccia di prodotto, con una logica chiara, una gerarchia coerente e un potenziale valore nel medio termine.
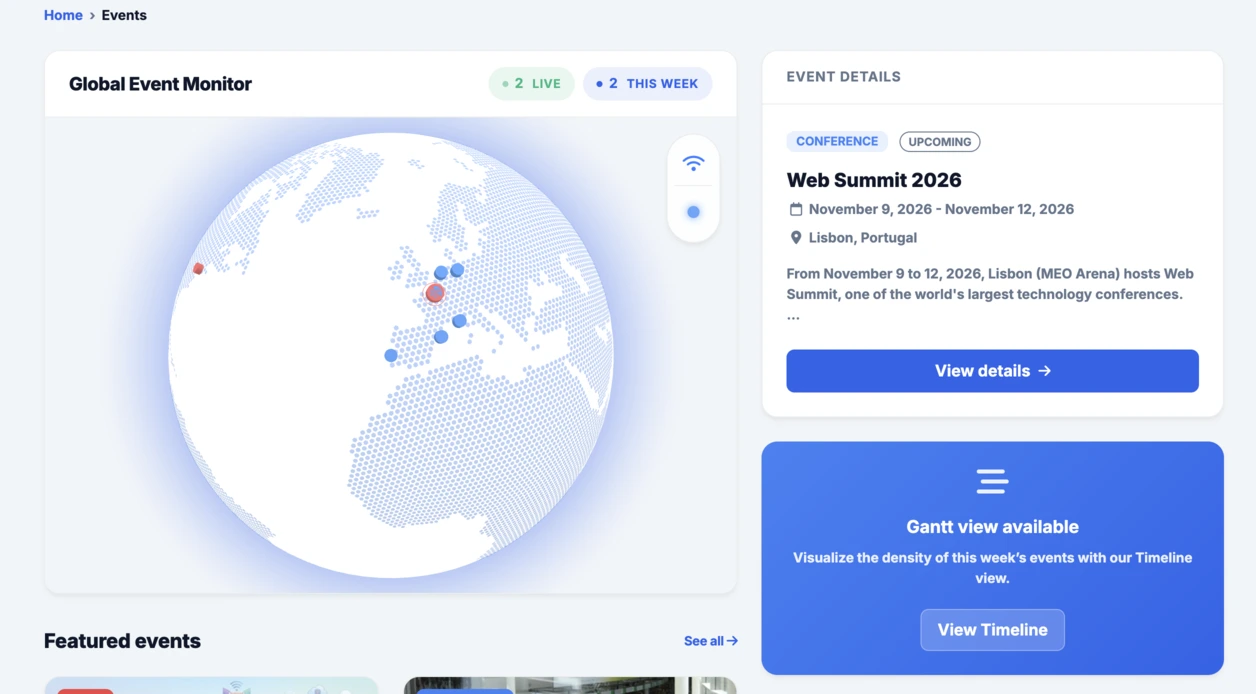
Dopo il globo interattivo integrato nella sezione Events, anche questa dashboard radiale prosegue bene la stessa logica: testare rapidamente, visualizzare in modo concreto e poi decidere se l’idea meriti di essere sviluppata ulteriormente dentro Linkeum.