בפרומפט יום שלישי ה-15 הזה, הרעיון היה לבדוק סוג חדש של ממשק שימושי ובעל עוצמה חזותית: דאשבורד להתקדמות אישית לצורך מעקב אחרי מטרות בתחומים המרכזיים של החיים.
ב-Linkeum, פרומפטי יום שלישי אינם משמשים רק ליצירת דמואים מרשימים מבחינה חזותית, אלא גם לבדיקת ממשקים שיום אחד עשויים להפוך לחלקים אמיתיים של המוצר. במהדורה ה-15 הזו, הרעיון היה לייצר דאשבורד להתקדמות אישית שמסוגל להציג בצורה ברורה את ההתקדמות של המשתמש בכמה ממדים של חייו.
המטרה הייתה לעבור מעבר לרשימת מטרות פשוטה ולדמיין רכיב דאשבורד אמיתי, שיהיה קריא, מודרני ובעל נוכחות חזותית חזקה מספיק כדי להצדיק חקירה מעמיקה יותר.
הפרומפט שבו נעשה שימוש
הפעם הפרומפט נכתב במצב code only כדי לקבל ישירות קובץ HTML עצמאי, שקל לבדוק, קל לצלם ממנו צילום מסך, וייתכן שאפשר יהיה לעשות בו שימוש חוזר בהמשך בתוך Linkeum.
הפרומפט שנשלח ל-Qwen היה הבא:
Generate code only.
Create a single self-contained HTML file with embedded CSS and JavaScript that builds a premium “Life Progress Dashboard” for Linkeum.
GOAL
The dashboard must help a user track progress across the major areas of life based on personal goals.
This is not a landing page.
This is not a marketing page.
This is a real product dashboard section designed for daily use.MAIN VISUAL
Build a large multi-ring radial progress chart as the main hero visualization.
Use a free JavaScript charting library suitable for radial / circular progress visualization.
Prefer Apache ECharts.The chart must represent 8 life categories:
- Wealth
- Career
- Learning
- Health
- Network
- Personal Projects
- Discipline
- Well-being
Each category must have:
- a progress percentage,
- a target marker or target logic,
- a label,
- a distinct but refined visual treatment.
Use realistic sample values such as:
- Wealth: 78
- Career: 64
- Learning: 82
- Health: 71
- Network: 58
- Personal Projects: 69
- Discipline: 75
- Well-being: 67
At the center of the radial visualization, display:
- “Overall Progress”
- and a combined percentage, for example 71%
The radial chart should look elegant, structured, readable, and premium.
Do not make it look playful or gimmicky.
Do not create a chaotic radar chart.
Do not use a generic fitness-app aesthetic.LAYOUT
Create a full dashboard section around the chart with:
- A left or center main chart area.
- A right-side details panel with category cards.
- Small KPI cards above or below for:
- Current streak
- Goals completed this week
- Best momentum
- Needs attention
- A “Focus Areas” card listing:
- Top 2 categories falling behind
- Top 2 categories improving fastest
- Small trend indicators or mini progress bars in the detail cards.
DESIGN STYLE
The design must match a premium Linkeum-like style:
- deep navy background or navy-tinted surfaces
- lighter blue highlights
- subtle amber/gold accents
- clean white or off-white text
- modern, professional, executive-grade UI
- modern fintech + personal intelligence dashboard
Avoid:
- neon colors
- rainbow palettes
- glassmorphism overload
- generic startup hero sections
- excessive gradients
- cartoonish visuals
Use a refined design system with:
- modern spacing
- subtle borders
- soft shadows
- polished cards
- clean typography
- a strong visual hierarchy
TECHNICAL REQUIREMENTS
- Output only one HTML file
- Include all CSS and JavaScript inside the HTML
- Use CDN imports only if needed
- Prefer Apache ECharts via CDN
- The result must run immediately when saved as an .html file and opened in a browser
- No external assets except the chart library CDN and web fonts if needed
- No frameworks like React, Vue, or Tailwind
- Pure HTML, CSS, and JavaScript only
- Code must be clean, readable, and well-structured
RESPONSIVENESS
The dashboard must be responsive.
- On desktop: chart + side panel layout
- On mobile: stacked layout with excellent readability
- Maintain strong visual hierarchy on smaller screens
INTERACTION
Even if this is a static HTML demo, make the UI feel interactive:
- hover states on cards
- hover emphasis on chart areas if possible
- subtle animated loading for the chart
- filter tabs such as 7D / 30D / 90D / 1Y
- active state styling
CONTENT
Use realistic product-like copy, for example:
- “Your life goals at a glance”
- “Focus on what moves the needle”
- “2 categories need attention this week”
- “Momentum is strongest in Learning and Wealth”
QUALITY BAR
The result should look like a real product dashboard mockup that could be screenshotted for an article and potentially reused later in a real product.Do not explain anything.
Do not output markdown.
Do not wrap the code in triple backticks.
Output raw HTML only.
התוצאה
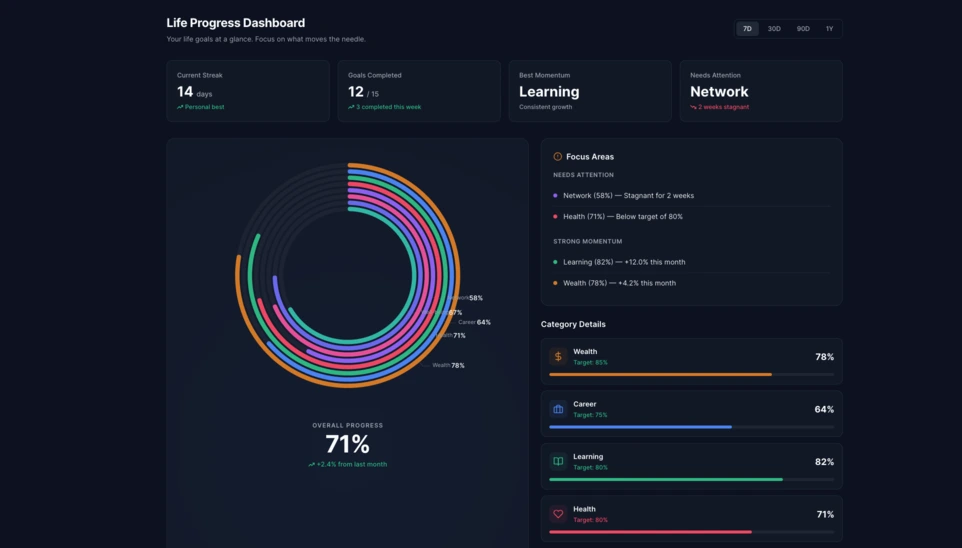
התוצאה ש-Qwen יצר מהווה בסיס משכנע מאוד. הממשק בנוי סביב גרף רדיאלי גדול מרובה טבעות במרכז, בליווי כרטיסי KPI, פאנל פוקוס ובלוקים של פרטים לכל קטגוריה.
מה שהופך את הבדיקה הזו למעניינת אינו רק האפקט החזותי. חשוב עוד יותר מכך, שה-AI יצר מבנה דאשבורד אמין וניתן לשימוש חוזר, שכבר עכשיו נקי ומסודר מספיק כדי לשמש בסיס למודול עתידי של Linkeum.
למה הבדיקה הזו חשובה
פרומפט יום שלישי הזה מראה שפרומפט טוב יכול לייצר יותר מדמו מרשים בלבד. הוא יכול גם לעזור ליצור במהירות אבטיפוס של ממשק מוצר אמיתי, עם לוגיקה ברורה, היררכיה עקבית וערך פוטנציאלי לטווח הבינוני.
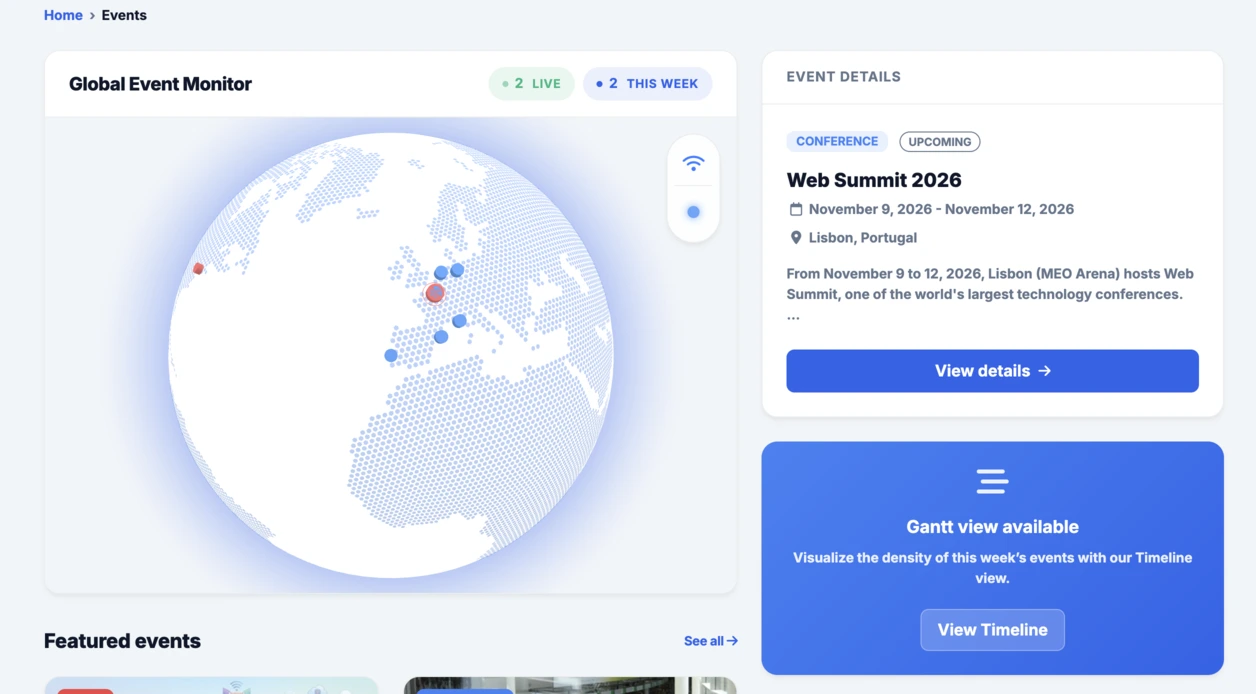
אחרי הגלובוס האינטראקטיבי ששולב במדור Events, גם הדאשבורד הרדיאלי הזה ממשיך היטב את אותה לוגיקה: לבדוק מהר, להמחיש בצורה קונקרטית, ואז להחליט אם הרעיון ראוי לפיתוח נוסף בתוך Linkeum.