To convince investors, a good idea is not enough: you need clear visual data and an impactful design. This week, we test the power of AI (with the Qwen model) to instantly generate the master slide of a pitch deck. Our use case? Launching a premium French bakery in West Hollywood.
When pitching an investment project, the visual aspect and the clarity of financial projections are crucial. Often, entrepreneurs waste precious time formatting slides or creating complex charts. For this 4th "Tuesday Prompt", we challenged the Qwen AI to act as both a financial strategist and a UI developer.
The goal? To get an impactful pitch structured around key performance indicators (KPIs) and charts, all coded (via Tailwind CSS and Chart.js) to be visualized instantly.
This Week's Prompt
Here is the exact command used. Feel free to copy it, change the industry, and adapt it to your own yield goals to test your own business ideas:
Act as an expert startup founder and UI developer. I am pitching a premium, authentic French bakery in West Hollywood, Los Angeles, to investors.
Generate a single, visually stunning Pitch Deck slide in a single HTML file. You must use Tailwind CSS (via CDN) for the styling and Chart.js (via CDN) for data visualization.
The slide must include:
- Header: A catchy bakery name, a strong tagline, and a brief value proposition.
- KPI Cards: 3 visually distinct metric cards for Year 1 (e.g., Projected Revenue, Average Ticket Size, Daily Foot Traffic).
- Financial Projections (Chart 1): A visually appealing Bar Chart showing Revenue vs. Profit margins for Year 1, Year 2, and Year 3.
- Target Market (Chart 2): A Doughnut Chart breaking down our West Hollywood customer demographics (e.g., Locals, Tourists, Corporate Events, Foodies).
Design Requirements:
- Use a premium, modern color palette (e.g., deep navy blue, gold, and warm beige for a French luxury feel).
- Make the layout grid-based, simulating a 16:9 widescreen presentation slide.
- Include the complete, working \<script> tags to render the Chart.js graphs beautifully with animations.
Output ONLY the complete HTML code so I can copy, paste, and render it immediately in my browser.
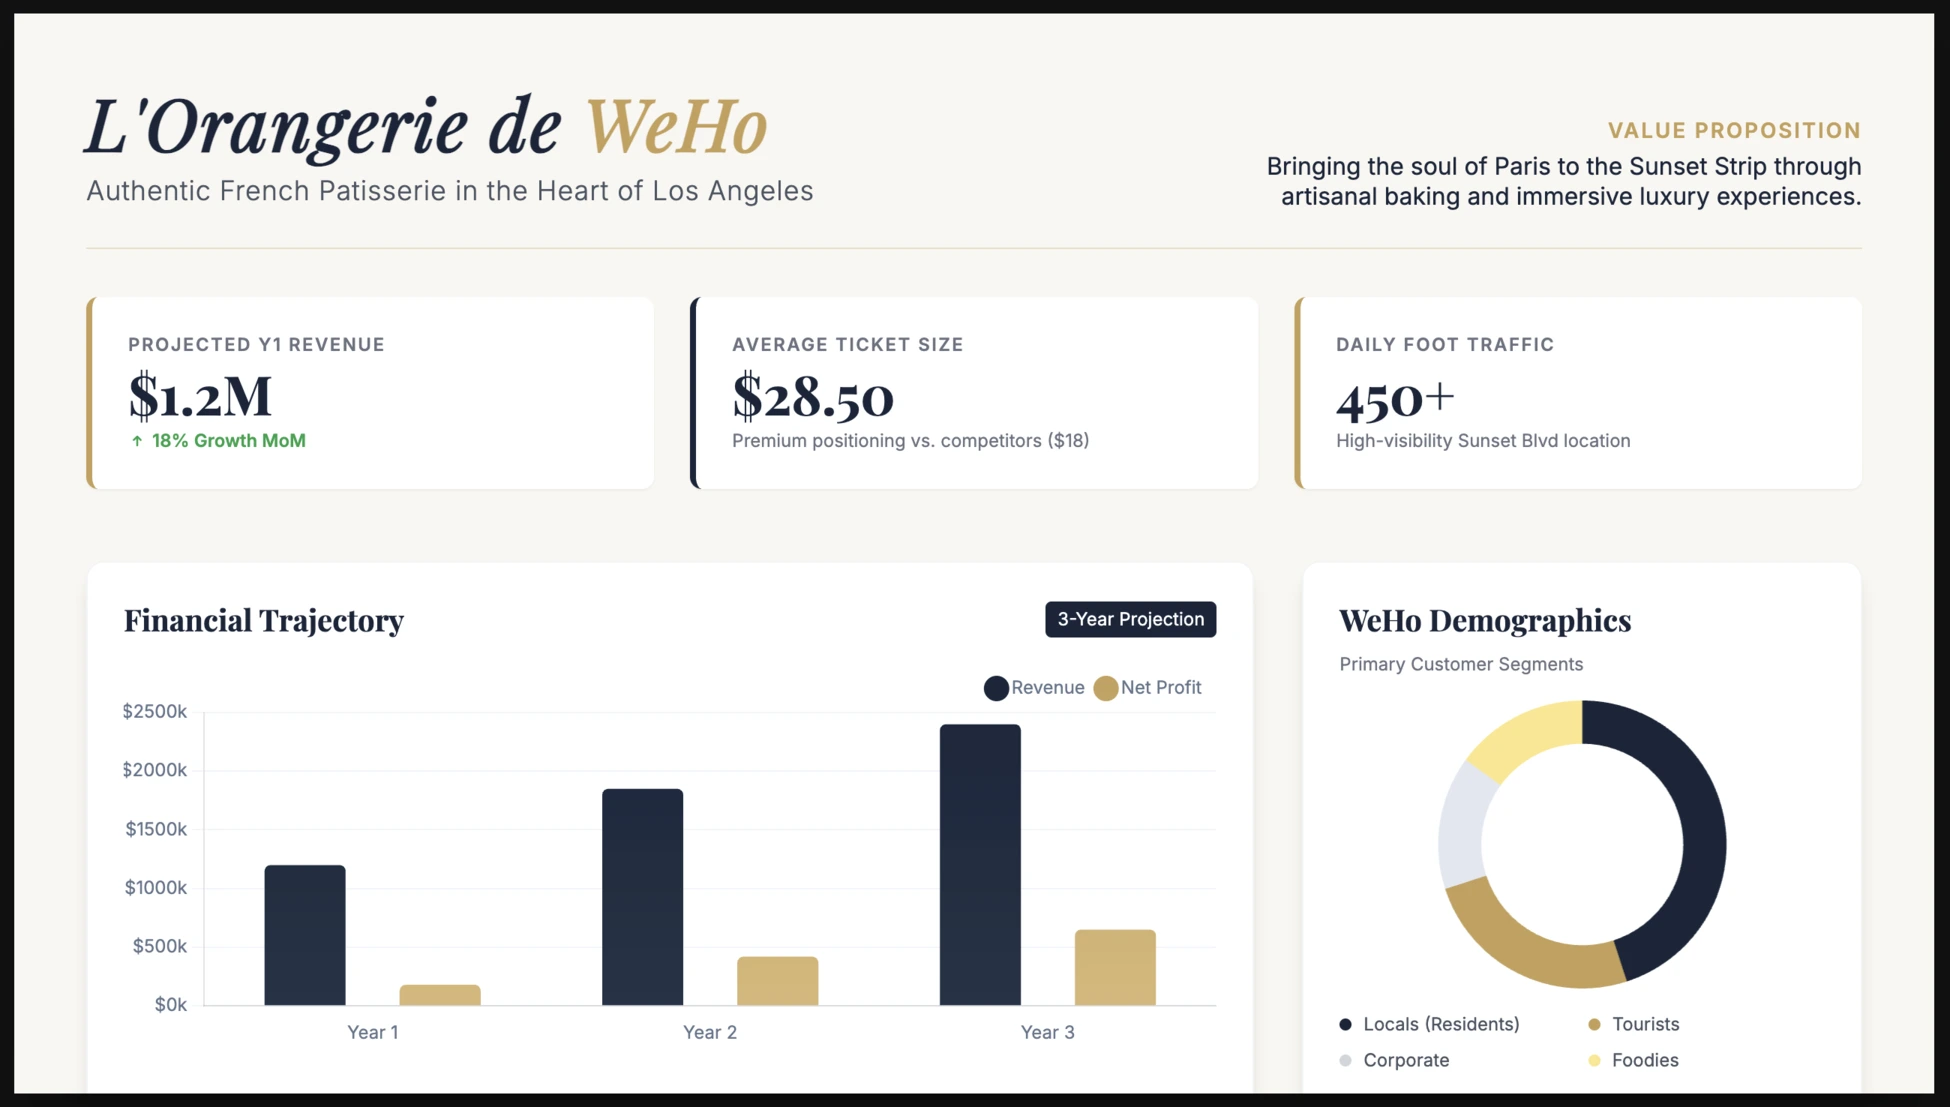
The Visual Render
Rather than sharing the raw lines of code generated by the AI, you can discover the visual result directly at the top of this article, as it appears once the file is opened in a web browser.
Why is this format highly effective for investors?
- Instant financial clarity: Investors immediately see profit margins and 3-year revenue growth thanks to the bar chart.
- Precise market targeting: The doughnut chart demonstrates a clear understanding of West Hollywood's specific customer base, providing reassurance on sales potential.
- Premium Design by AI: The color instructions (navy blue, gold, beige) force the AI to adopt a high-end positioning, without needing to hire a designer at this early stage of the project.
By using LLMs to prototype the structure and data of your presentations, you spend less time on formatting and more time on the pure analysis of your profitability.