For this Prompt Tuesday #9, we combine finance and web development. Right in the middle of dividend season, discover how to use Gemini AI to instantly code a modern Dashboard in HTML, JavaScript, and Tailwind CSS.
Blending personal finance and web development is the core of Linkeum's DNA. As we enter the famous "dividend season" (April, May, June), many investors and developers are looking to create their own tracking tools.
In this test, the goal is to use Gemini (Google's AI) to generate the complete Front-End code for a dividend dashboard from scratch. We require it to use simple, universal technologies with no heavy setup: pure HTML, native JavaScript (Vanilla JS), the Chart.js library for the graph, and Tailwind CSS for the design.
The Prompt
To ensure the AI generates a file that is directly usable in a browser, you must give it a specific role, enforce the use of CDN links for libraries, and provide the business context. Here is the exact prompt used:
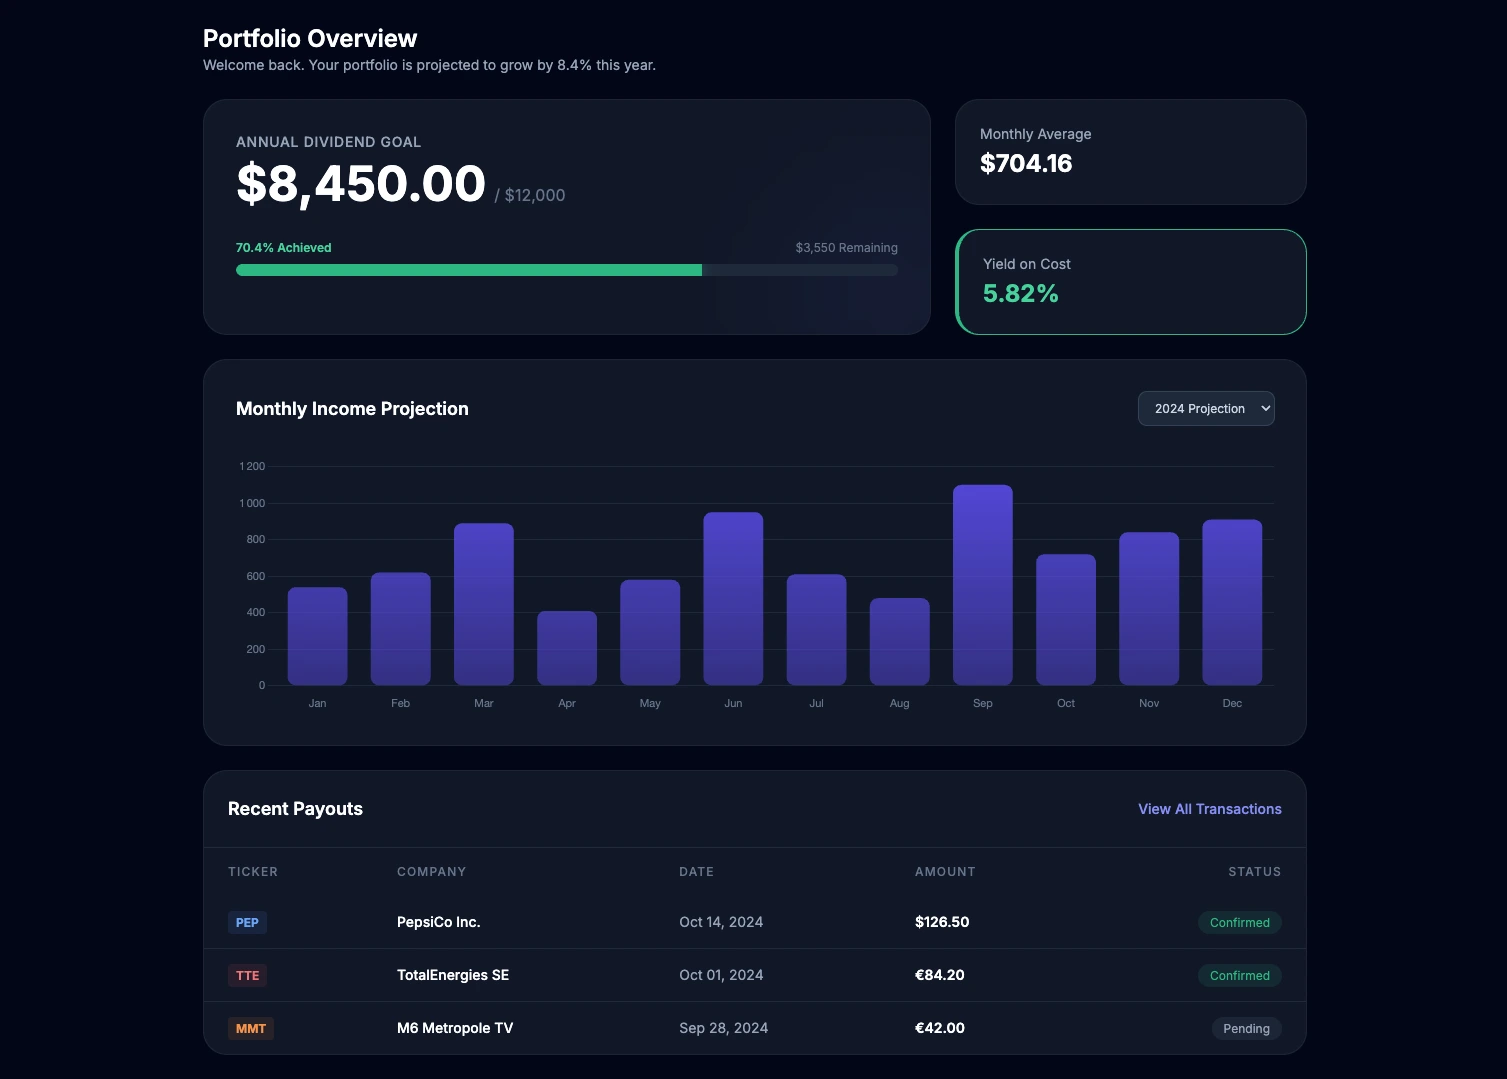
Act as an expert Front-End Developer. Write a modern, responsive single-page HTML file for a "Dividend Tracking Dashboard" using Tailwind CSS (via CDN) and vanilla JavaScript. Include a chart using Chart.js (via CDN) to visualize monthly dividend income. The UI should have a sleek dark mode aesthetic. Include a main card showing the total yearly dividend goal with a progress bar. Below that, display a neat list or grid of recent dividend payouts using mock data for the following stocks: M6 Metropole, Pepsico, and TotalEnergies. Make the design look premium, similar to high-end fintech apps. Output the complete, functional code so I can copy-paste it directly into an index.html file.
What the prompt aimed to achieve
The challenge of this prompt was to transform a financial idea into a visual and instantly testable web interface:
- Define a "Plug & Play" tech stack: By requiring HTML, native JS, and CDN links for Tailwind and Chart.js, we ensure the resulting code works immediately by simply double-clicking the file, without needing a complex development environment.
- Integrate Data Visualization: The explicit request for an interactive chart (Chart.js) forces the AI to write the necessary JavaScript logic to instantiate and configure the visual canvas for monthly income.
- Impose an art direction: The terms "sleek dark mode aesthetic" and "high-end fintech apps" guide Gemini to propose a premium design (shadows, gradients, dark colors) suited for finance.
- Integrate business logic: Including a progress bar toward a yearly goal and specific stocks (M6, Pepsico, TotalEnergies) provides an immediately relevant rendering for an investor.
Why the result is interesting
This result demonstrates Gemini's power as a coding assistant. The AI does not just align HTML tags; it properly structures the page, intelligently imports external scripts, writes the Chart.js JavaScript logic, and applies Tailwind CSS utility classes for an aesthetic and responsive rendering.
For a developer or project creator, this is a massive time saver. Instead of spending hours reading Chart.js and Tailwind documentation to structure a mockup, you get a solid and visual foundation in seconds, which only needs to be connected to real data.
Key Takeaways
No comments yet. Be the first to react!


Log in to join the discussion.