For this Prompt Tuesday #11, we ask AI to generate an impressive HTML/JavaScript visualization: a rotating 3D globe where major world stock exchanges light up based on their open/closed status.
Between two development sessions on Linkeum, there are sometimes ideas that immediately make you want to test how far AI can go. For this Prompt Tuesday #11, the goal was ambitious: ask Qwen to generate an HTML/JavaScript page capable of displaying a rotating 3D globe, with the world's largest stock exchanges represented by glowing points that change state depending on whether the market is open or closed.
The idea was simple on paper, but highly visual in its rendering. Each financial center had to appear as a pulsing green dot when the exchange is open, or red when it is closed, with the ability to click on it to display a small window containing its main information.
The prompt used in Qwen
As is often the case for this type of generation, the prompt was written in English. Code generation models generally better understand detailed technical instructions in this language, especially when it comes to combining HTML structure, JavaScript logic, visual rendering, and user interactions.
Act as an expert Front-End Developer and Data Visualization specialist. Write a modern, responsive single-page HTML file that renders an interactive 3D globe using the
globe.gllibrary (andthree.js) via CDN, along with Tailwind CSS for styling.Here are the exact requirements:
- The Globe: Render a beautiful, dark-themed, highly detailed 3D globe. It should auto-rotate slowly.
- The Data: Plot the top 10 major world stock exchanges (e.g., NYSE, LSE, Tokyo, Shanghai, Euronext Paris, etc.) using their real latitude and longitude.
- Market Status Logic: Write JavaScript logic that uses the current UTC time to determine if each market is currently OPEN or CLOSED based on their real-world trading hours.
- Visual Markers: Represent each exchange on the globe as a glowing, pulsating point. Make the point Green and pulsating if the market is OPEN, and Red and pulsating if the market is CLOSED.
- Interactivity: When the user clicks on a point:
- Stop the globe's auto-rotation.
- Open a sleek, dark-themed HTML pop-up/tooltip floating above the globe displaying the Exchange Name, City, Local Time, and Status (Open/Closed in green/red text).
- Clicking elsewhere on the globe should close the pop-up and resume rotation.
- UI/Aesthetics: Give the page a premium, high-end fintech aesthetic (dark mode, glassmorphism for the pop-up, sleek typography).
Output the complete, fully functional HTML, CSS, and JS code in a single file so I can copy-paste it into an
index.htmlfile and run it immediately in my browser.
Why this prompt was interesting
What I like about this prompt is that it doesn't just ask for "a 3D globe". It simultaneously imposes a visual rendering, business logic, geographical data, and interactive behavior, which really pushes the AI to produce something close to a mini-product rather than a simple code example.
In other words, we are not only testing Qwen's ability to write JavaScript. We are also testing its ability to understand a finance-oriented design intent, with an interface that already evokes a premium dashboard.
A few tweaks with Gemini
The initial result obtained with Qwen was already very promising. We could see the points, the animation, the click interaction, and it immediately felt like we were very close to a spectacular rendering.
However, a few adjustments had to be made to stabilize the display and improve the visual staging. With the help of Gemini, we therefore tweaked some technical and presentation details, notably regarding the rendering of the globe, the initial framing, the readability of the continents, and the camera behavior upon loading.
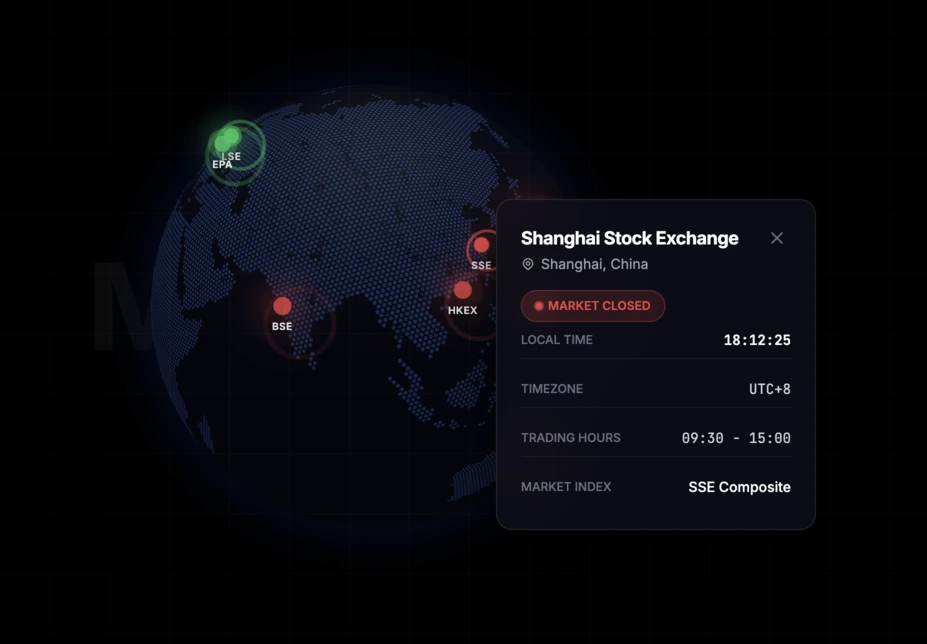
A mind-blowing result
The final result is frankly mind-blowing. We get an elegant, lively, interactive 3D globe, with glowing points that immediately give the impression of a global trading floor.
It's exactly the kind of experience that catches the eye in the first few seconds. And above all, it's not just a visual gadget: behind this animation, one can already imagine a real product use case to track major financial markets intuitively.
What's next?
This is probably the most interesting part of this Prompt Tuesday #11. The rendering is convincing enough to make me want to go further than a simple blog post.
I will try to integrate this idea later into Linkeum, in the Finance section. With a real data layer and a few extra refinements, this interactive globe could become an excellent "wow effect" element for users.